
Healthcare Call Center Metrics: 12 KPIs That Actually Matter
TL;DR: Healthcare Call Center Metrics
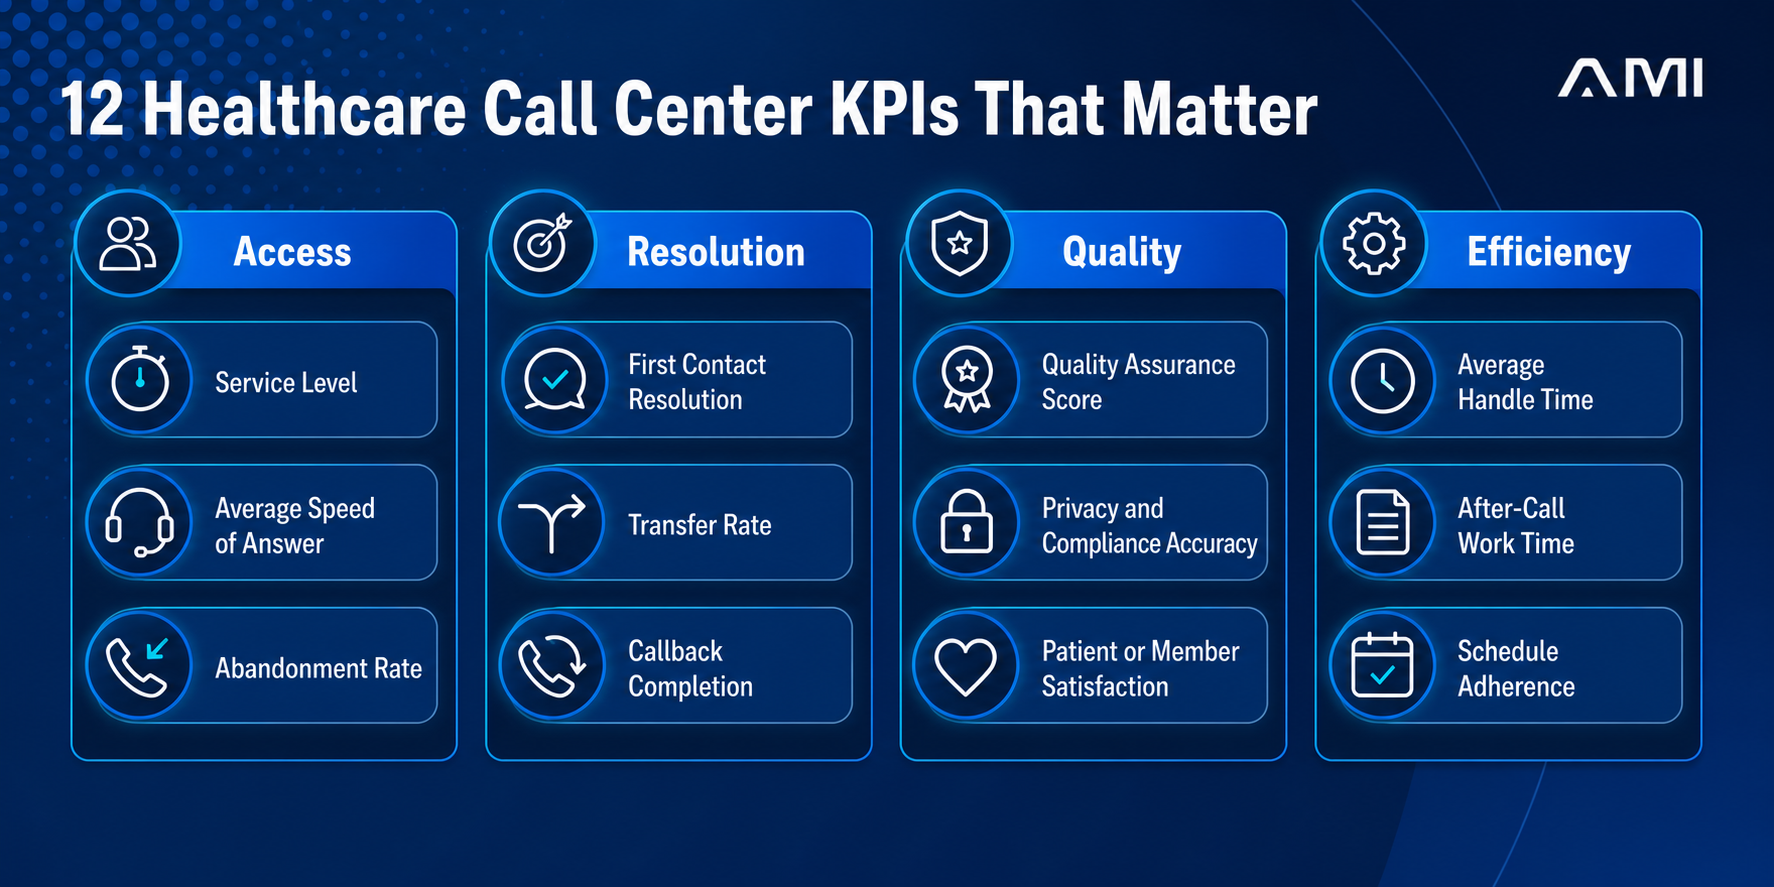
A balanced healthcare call center scorecard measures access, resolution, quality, compliance, and efficiency together.
Service level, speed of answer, and abandonment reveal whether callers can reach support.
First contact resolution, transfers, and callback completion show whether requests move toward closure.
Quality assurance, compliance accuracy, and satisfaction protect trust beyond queue speed.
Handle time, after-call work, and schedule adherence support planning when paired with quality safeguards.
Targets should reflect queue purpose, caller risk, workflow complexity, and documented calculation rules.
Healthcare call center metrics should show whether patients, members, and providers can reach the right support, receive an accurate answer, and move their issue toward resolution. A dashboard focused only on call volume and average handle time can miss the outcomes that matter most in healthcare: access, resolution, quality, privacy, and dependable follow-through.
The strongest measurement model balances customer experience with operational control. Speed matters, but a fast interaction is not successful when the caller must repeat information, receives an incorrect answer, is transferred unnecessarily, or waits for a promised callback that never arrives.
This guide explains 12 healthcare call center KPIs, how to calculate them, what each one reveals, and how leaders can use them without creating counterproductive pressure on agents.
Need stronger operational support across healthcare workflows? Explore AM InfoWeb's healthcare services.
What Are Healthcare Call Center Metrics?
Healthcare call center metrics are quantitative measures used to evaluate access, responsiveness, resolution, quality, compliance, customer experience, and workforce execution across telephone-support workflows. They may apply to patient access centers, payer member services, provider contact centers, nurse advice lines, revenue cycle teams, and other healthcare support operations.
The right metric set depends on the workflow. An appointment-scheduling line, a clinical triage service, and a payer provider-services queue should not share identical targets. Each team should define the population, queue, channel, business hours, exclusions, and calculation logic before comparing results.
CMS has historically monitored provider contact centers through measures such as average speed of answer, completion rate, IVR handling, call quality, knowledge skills, and privacy performance. Its Provider Customer Service Program performance data illustrates why healthcare leaders need both operational and quality measures.
Why Do Healthcare Call Centers Need Balanced KPIs?
Every metric creates an incentive. If leaders emphasize short calls, agents may rush discovery or documentation. If they focus only on satisfaction, difficult but correctly handled interactions may appear worse than simple requests. If they track service level without resolution, queues can improve while repeat calls and transfers grow.
A balanced scorecard should answer four questions:
- Can callers reach support within an acceptable time?
- Can the team resolve or correctly advance the request?
- Is the interaction accurate, secure, and respectful?
- Can the operating model sustain the work reliably?
AHRQ advises healthcare organizations to assess whether telephone systems are easy for patients to use and to collect feedback before and after improvements. Its patient-friendly telephone guidance reinforces the connection between access metrics and patient experience.
Which 12 Healthcare Call Center KPIs Actually Matter?
The following metrics form a practical starting point. Leaders should segment results by queue, call reason, payer or provider workflow, language, location, and time period so aggregate averages do not hide concentrated problems.
1. Service Level
Service level is the percentage of eligible calls answered within a defined threshold.
Formula: Calls answered within threshold divided by eligible offered calls, multiplied by 100.
This metric shows whether staffing and routing can meet the organization's access promise. The threshold and treatment of short abandons must be documented. CMS has used defined service-level calculations for provider contact centers, but organizations should set targets according to their own workflow, risk, demand pattern, and contractual requirements.
2. Average Speed of Answer
Average speed of answer measures the average queue time before a caller reaches a live agent.
Formula: Total answered-call queue time divided by answered calls.
ASA helps identify access friction, but it should be read alongside abandonment and service level. A reasonable average can conceal severe waits during peak hours or within a specific language queue. AHRQ has described telephone-access improvement using average speed to answer and abandonment measures in its customer-service standards guidance.
3. Call Abandonment Rate
Call abandonment rate is the percentage of queued callers who disconnect before reaching an agent.
Formula: Abandoned queued calls divided by calls offered to the queue, multiplied by 100.
High abandonment may indicate excessive wait time, confusing IVR paths, poor callback options, or a mismatch between staffing and demand. Define whether very short abandons are excluded and report the threshold consistently.
4. First Contact Resolution
First contact resolution measures the percentage of eligible inquiries resolved during the initial interaction without a preventable repeat contact or agent callback.
Formula: Eligible contacts resolved on first contact divided by total eligible contacts, multiplied by 100.
FCR is an outcome metric, not simply an agent disposition code. Strong measurement may combine call coding with repeat-contact, case, ticket, and callback data. Clinical escalation, required documentation, and payer dependencies should be excluded when they make first-contact completion inappropriate.
5. Transfer Rate
Transfer rate is the percentage of answered calls moved to another agent, queue, department, or external destination.
Formula: Transferred calls divided by answered calls, multiplied by 100.
Transfers can be necessary, especially for licensed clinical decisions, complex benefits, authorization, or escalation. The useful question is whether the transfer was correct and avoidable. Segment warm transfers, cold transfers, repeated transfers, and incorrect routing.
6. Callback Completion Rate
Callback completion rate measures whether promised or required callbacks are completed within the defined service window.
Formula: Callbacks completed within target divided by callbacks due, multiplied by 100.
This metric exposes work that disappears after the live call. Track overdue callbacks, attempt count, successful connection, final disposition, and exceptions. CMS provider-contact-center guidance has historically required reporting on inquiries not resolved during the initial contact and the status of callbacks.
7. Quality Assurance Score
Quality assurance score measures performance against an approved interaction scorecard. Criteria may cover verification, discovery, accuracy, empathy, documentation, escalation, required disclosures, and closure.
Formula: Points earned divided by applicable scorecard points, multiplied by 100.
Scores require calibrated reviewers, representative sampling, clear critical-failure rules, and documented coaching. A high score from a small or biased sample should not be treated as proof of broad quality.
8. Privacy and Compliance Accuracy
Privacy and compliance accuracy measures whether interactions follow identity verification, minimum-necessary access, disclosure, consent, call-recording, documentation, and escalation requirements applicable to the workflow.
Formula: Compliant audited interactions divided by audited interactions, multiplied by 100.
Critical failures should also be reported separately because an average can dilute serious risk. HHS explains that regulated entities need appropriate access controls, workforce supervision, and safeguards for electronic protected health information in its HIPAA Security Rule summary.
9. Patient or Member Satisfaction
Patient or member satisfaction captures the caller's perception of access, clarity, courtesy, effort, and confidence in the resolution.
Formula: Satisfied survey responses divided by valid responses, multiplied by 100.
Survey wording, channel, timing, and response rate affect the result. Use satisfaction with verbatim feedback, complaint themes, repeat contacts, and operational data. AHRQ's CAHPS program demonstrates the value of standardized patient-experience measurement.
10. Average Handle Time
Average handle time measures the average total time required to manage an interaction, commonly including talk, hold, and after-call work.
Formula: Total talk time plus hold time plus after-call work time, divided by handled calls.
AHT is useful for forecasting and process analysis, but it should not function as a standalone quality target. A longer call may be appropriate when the caller has complex coverage questions, accessibility needs, clinical risk, or multiple connected requests.
11. After-Call Work Time
After-call work time measures the average time agents spend completing required tasks after the caller disconnects.
Formula: Total after-call work time divided by handled calls.
CMS guidance describes after-call work as the time needed for documentation and other actions associated with a completed call. High ACW may point to slow systems, duplicate entry, unclear workflows, or work that could be automated. Low ACW can also signal incomplete documentation, so quality results must remain visible.
12. Schedule Adherence
Schedule adherence measures whether agents are available for assigned work at the planned times, accounting for approved activities and exceptions.
Formula: Time in adherent scheduled states divided by scheduled time, multiplied by 100.
Adherence helps explain service-level performance and forecast execution. It should be applied fairly, with allowances for coaching, training, system outages, complex calls, accommodations, and approved offline work. It is a workforce-planning measure, not a substitute for trust or sound supervision.
How Should Leaders Set Healthcare Call Center Targets?
Targets should begin with baseline data, caller needs, regulatory or contractual commitments, risk, and workflow complexity. Copying a generic industry benchmark can create the wrong operating behavior.
Use distributions instead of averages where possible. Report the median and upper percentiles for wait time, handle time, and callback completion. Segment by queue and call reason. Then set a target, warning range, and escalation threshold for each KPI.
Targets should also be paired. For example:
| Operational Target | Balancing Measure |
|---|---|
| Lower average handle time | Quality score and repeat-contact rate |
| Higher first contact resolution | Escalation accuracy and compliance |
| Lower abandonment | Service level and callback uptake |
| Higher schedule adherence | Quality, occupancy, and agent wellbeing |
| Higher self-service completion | Error rate and live-agent recovery |
Review targets after material changes to volume, IVR design, service lines, payer rules, staffing, technology, or caller demographics.
Need disciplined patient, member, and provider support workflows? Explore AM InfoWeb's AI Contact Center Operations.

Why do healthcare contact centers need more than faster answers?
Because access, resolution, accuracy, privacy, and follow-through must improve together. AM InfoWeb helps healthcare organizations combine AI-assisted workflows with skilled human execution and accountable quality controls.
How Can Teams Build a Reliable KPI Dashboard?
Start with a metric dictionary. For every KPI, document the formula, system of record, owner, refresh frequency, business hours, exclusions, thresholds, and segmentation. This prevents two departments from using the same label for different calculations.
Connect telephony data with CRM, ticket, scheduling, quality, survey, complaint, and workforce-management data. A queue report alone cannot prove resolution or accuracy. Leaders should be able to trace a change in one metric to call reasons, workflows, teams, and downstream outcomes.
Use the dashboard to investigate variation, not punish isolated results. Weekly operating reviews can identify immediate exceptions, while monthly reviews can focus on root causes, repeated failure patterns, and improvement actions.
What KPI Mistakes Should Healthcare Leaders Avoid?
Common measurement mistakes include:
- Optimizing speed without monitoring accuracy or resolution
- Comparing unlike queues or call reasons
- Changing calculation logic without documenting the change
- Treating every transfer or escalation as a failure
- Ignoring language, accessibility, and peak-period performance
- Using tiny QA or survey samples as broad conclusions
- Reporting averages that hide extreme waits or overdue callbacks
- Tracking agent activity without fixing broken processes or systems
The objective is not to maximize every metric independently. It is to improve access and outcomes while protecting accuracy, privacy, staff sustainability, and appropriate clinical or operational escalation.
How AM InfoWeb Supports Healthcare Call Center Performance
AM InfoWeb supports healthcare providers and payers with structured contact-center operations, trained teams, quality assurance, escalation controls, and performance reporting.
With two decades of experience in the U.S. healthcare industry, AM InfoWeb uses a co-managed model that brings AI agents and skilled human agents together to eliminate process bottlenecks and execute secure healthcare workflows.
AM InfoWeb can support:
- Patient, member, and provider inquiry workflows
- Intake, verification, routing, and documentation
- Appointment and scheduling support
- Eligibility and benefits workflows
- Callback and case follow-up
- Quality monitoring and calibration
- Agent coaching and knowledge support
- KPI reporting and root-cause analysis
Co-managed execution helps healthcare organizations increase capacity and visibility while retaining governance, escalation authority, and workflow control.
What Should Healthcare Contact Center Leaders Do Next?
Begin by selecting one access metric, one resolution metric, one quality or compliance metric, and one efficiency metric for each major queue. Validate the data definitions and establish a baseline before setting new targets.
Then examine where the metrics conflict. If handle time falls while transfers and repeat contacts rise, the process is moving work rather than resolving it. If service level improves but satisfaction falls, investigate accuracy, empathy, IVR friction, and callback performance.
Healthcare call center metrics matter when they lead to better decisions. A balanced scorecard turns activity data into a practical view of whether callers receive timely, accurate, secure, and complete support.
Need a clearer view of healthcare contact center performance? AM InfoWeb combines AI-assisted workflows, skilled human teams, QA, and operational reporting to improve access, resolution, and accountable execution.
Get in TouchFrequently Asked Questions
About the Author

Written by
Urza Dey
Urza Dey is a content and copywriter with over five years of experience across marketing, B2B SaaS, HealthTech, EdTech, and related industries. At AMI, they contribute to content strategy, blog development, and marketing communication focused on healthcare operations, business process management, and AI-enabled service delivery.